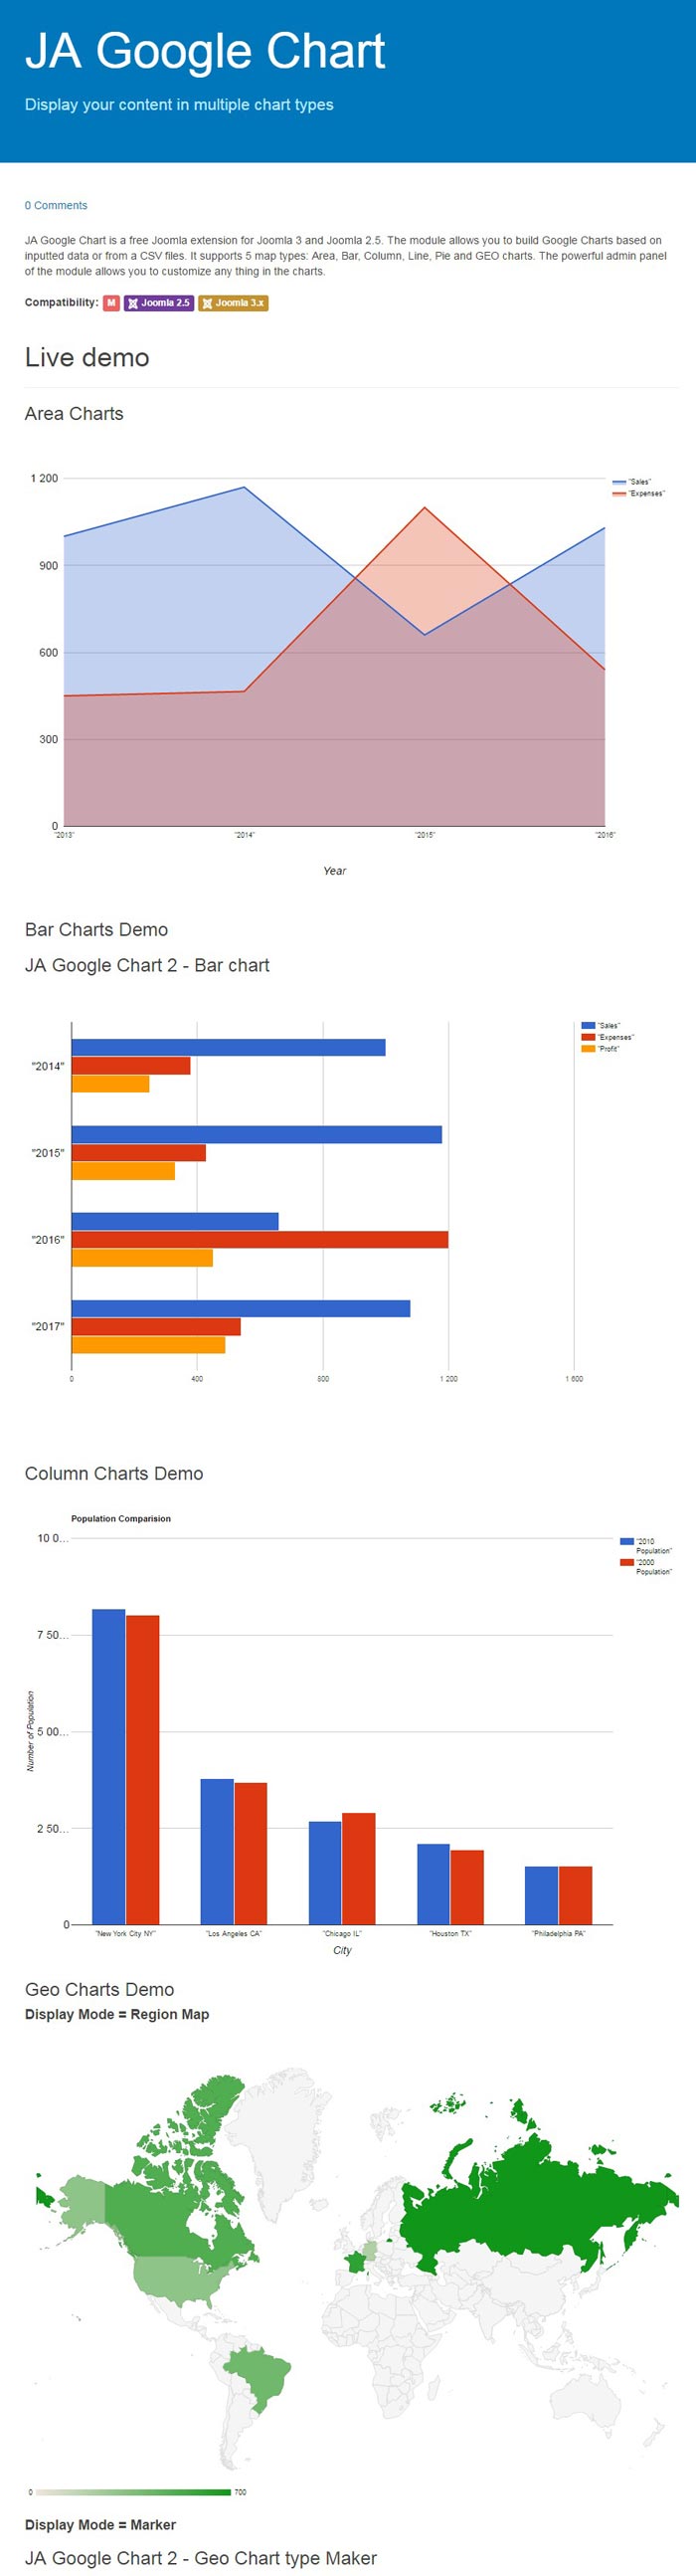
One of the key features of JA Google Chart is its compatibility with Google Charts API, a web-based charting tool that allows users to create custom charts with various data inputs. With this module, users can leverage the power of Google Charts API and integrate their own data sets to create dynamic, interactive charts that can be customized to match the look and feel of their website.
In addition to its powerful charting capabilities, JA Google Chart is also highly customizable, offering users a range of options for controlling the appearance and functionality of their charts. Users can choose from a variety of chart types, including line, bar, pie, and scatter charts, and can customize the colors, fonts, and labels of their charts to match their brand or visual style.
Overall, JA Google Chart is an excellent tool for anyone looking to create stunning, interactive charts and graphs for their Joomla website. Whether you are a business owner looking to present data to investors, an educator presenting research findings, or a researcher sharing statistical insights, JA Google Chart provides an easy and powerful solution for displaying data in a clear and compelling way.


 Sign in with Google
 Login with Facebook